learn what problem management is, how it is performed, how to measure its success, and how to support it in your business.
Navigate the Excel interface efficiently and understand its core components. Create, format, and manage workbooks and worksheets effectively. Input, edit, and manipulate data using various Excel tools and features. Apply basic and advanced formulas and functions to perform calculations and data analysis. Organize and analyze data using sorting, filtering, and PivotTables. Visualize data through static and dynamic charts, conditional formatting, and other graphical elements. Utilize advanced features such as XLookup for complex data operations. Collaborate with others by sharing workbooks and implementing data protection measures.
Optimize Excel for printing and presenting data effectively.
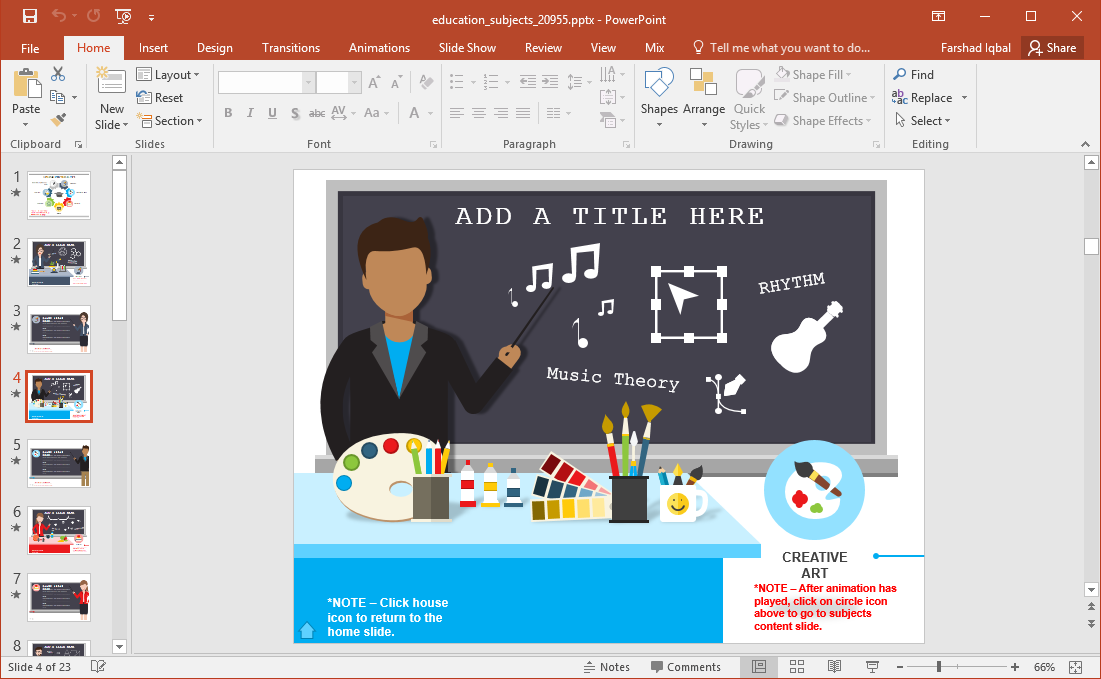
A PPT is a visual tool used to convey information clearly and effectively through slides. It helps organize content using text, images, charts and animation for impactful communication.

Microsoft teams is a collaboration platform that enables chat, video meetings, file sharing and app integration. It helps teams communicate and work together efficiently in real time.

An overview of HTML and its elements, understanding the power, linking and navigation. It provides images, graphics and media it has more ways to identify the content when put together in forms and interactive elements using structural data.

This module covers the fundamentals of spreadsheet software, including the use of the access toolbar, menu bar, and understanding workbooks and worksheets. It also introduces key functions such as data entry, autofill, average, sum, styling, layout, and chart creation for effective data management and analysis.
Power BI is Microsoft’s cloud-based business intelligence and data visualization platform that connects to a wide range of data sources, enabling the creation of interactive reports based on real-time data.
